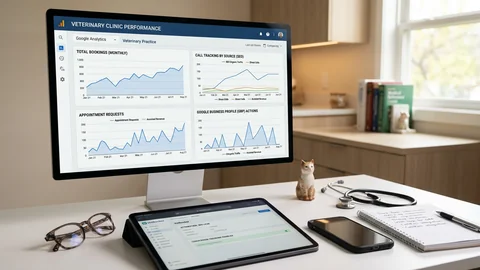
Measuring ROI of Pet Blog Automation: Rankings, Traffic, and Assisted Revenue

Table of Contents +
- Scenario: You automated 10 pet blog posts/month-how do you prove ROI?
- Quick decision guide
- Measurement model and instrumentation
- Event and attribution setup (GA4 + Search Console + eCommerce)
- Monitoring cadence
- Practical safety boundaries
- Evidence status and expected effect sizes
- Reporting templates and benchmarks
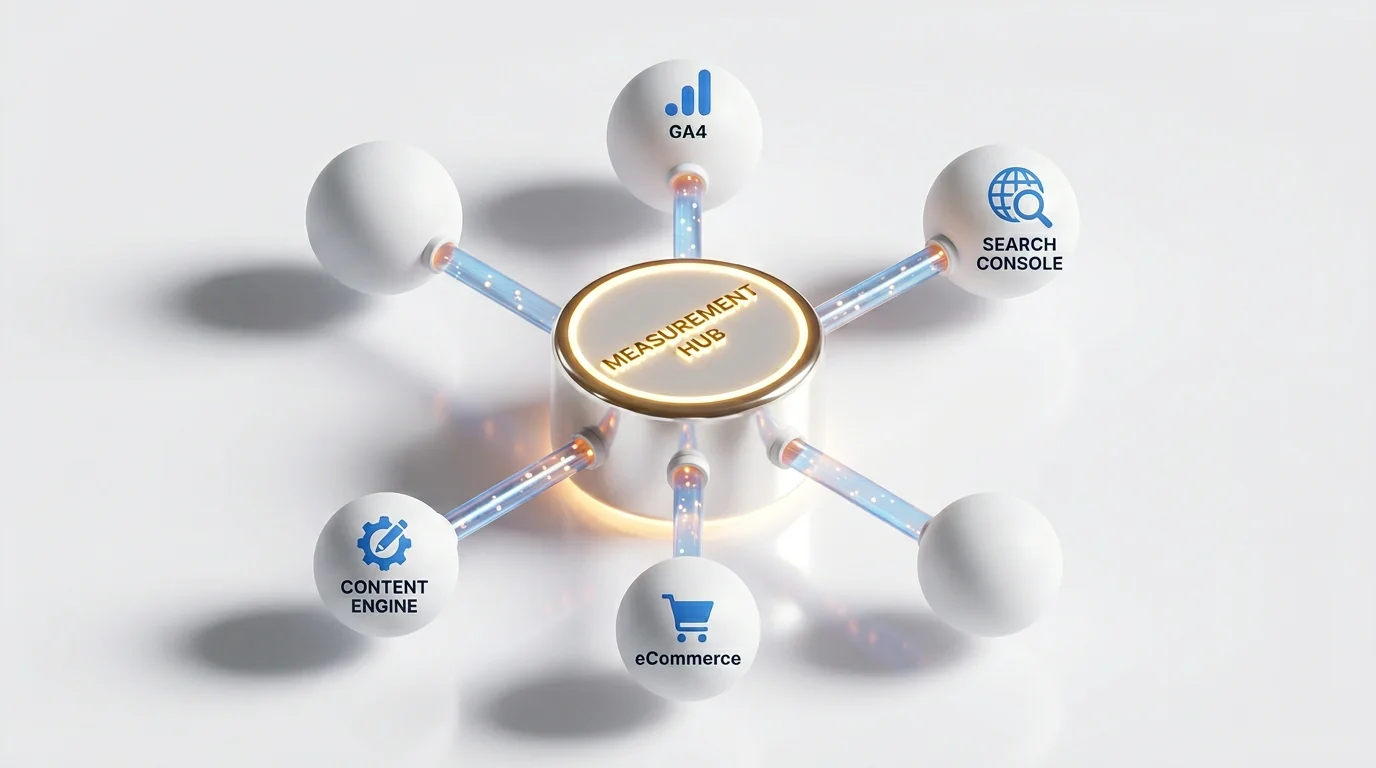
- Integration with the measurement and optimization hub
- Frequently Asked Questions
- Conclusion
- References
Learn how to measure ROI of pet blog automation with KPI hierarchies, assisted revenue, and tracking models. Evidence-based, practical, and scalable.
Automation accelerates content, but ROI decides its future. Leaders want proof that automated pet blogs drive measurable gains, not just more pages. Clear, defensible measurement turns automation into a reliable growth engine.
This guide explains a focused measurement plan for automated blogs. You will learn how to track keyword ranking growth, article-level conversions, assisted product revenue, and content velocity analytics. Expect practical thresholds, instrumentation steps, and guardrails.
Scenario: You automated 10 pet blog posts/month-how do you prove ROI?
Publishing ten automated articles monthly can lift visibility and revenue. Proving impact requires a structured plan linking pet SEO automation metrics to commercial outcomes. Establish a consistent pipeline of baselines, targets, and a clear KPI hierarchy.
Define a KPI hierarchy: visibility → engagement → conversion → revenue
Use a laddered model. Start with impressions and rankings, then sessions and depth, then micro and macro conversions, and finally assisted and direct revenue. For broader governance, reference the measurement and optimization hub to keep objectives aligned.
Set baselines and targets before automation begins
Document pre-automation metrics for 8-12 weeks. Capture topic-level rankings, non-brand sessions, and conversion rates. Define targets per topic cluster and device. Mark the automation start date for cohort analysis and hold back a control set if feasible.

Petbase handles this entire content workflow automatically - 10 SEO articles published to your blog every month - start your free trial.
Quick decision guide
Use these patterns to steer early optimization decisions without waiting for quarterly data. Adjust content, interlinking, and attribution views in small, testable increments to protect compounding effects.
If rankings rise but traffic is flat, then expand SERP features and internal links
Investigate snippets, FAQs, and images. Improve titles and meta descriptions. Add internal links to strengthen click paths from ranking posts to relevant guides and product pages, reducing reliance on a single result type.
If traffic grows but conversions lag, then refine intent and product linking
Audit intent match. Insert clearer CTAs and contextual product links. Surface comparison tables and size guides. Shorten steps to add-to-cart with relevant anchors and reinforce trust signals near key decision moments.
If last-click looks weak, then evaluate assisted revenue and multi-touch
Use GA4 multi-touch models to reveal contribution beyond last click. Review time decay and position-based views. Attribute post-view influence on product page visits, email signups, and return sessions that convert.
If branded search surges, then segment brand vs. non-brand lift
Separate brand and non-brand queries in Search Console. Attribute brand lifts partly to broader campaigns. Retain credit for non-brand growth driven by new topics and improved informational coverage.
If velocity is high but quality varies, then throttle and improve briefs
Cap weekly output temporarily. Enrich outlines with topical authority elements, multimedia, and FAQs. Enforce unique primary keywords per URL to prevent cannibalization and focus quality over quantity.
If a few posts outperform, then clone patterns with variations
Reverse-engineer winning formats, schema, and internal link placement. Replicate structures across adjacent subtopics and intents. Keep headlines distinct, and retest calls-to-action to scale conversion-positive templates.
Measurement model and instrumentation
Your instrumentation should isolate automation effects while acknowledging multi-touch reality. Evidence indicates analytics integration is central to iterative SEO improvement, enhancing data-informed decisions and forecasting accuracy over time.[3]
Rankings: topic-level and keyword-set tracking with control cohorts
Track keyword sets per topic cluster. Compare automated topics against a holdout cohort. Measure average rank, top-3 share, and coverage breadth. Build sets from your Automated Pet Keyword Research: Breeds, Life Stages, and Conditions framework.
Traffic: non-brand organic sessions segmented by country and device
Segment Search Console and GA4 by non-brand queries, country, and device. Attribute lifts to targeted geographies. Monitor CTR and landing page depth as corroborating signals of intent alignment and snippet wins.
Article-level conversions: micro and macro events mapped to goals
Define scroll depth, outbound clicks, and email signups as micro-goals. Track add-to-cart, checkout, and purchase as macro goals. Strengthen paths using From Blog to Basket: Automating Internal Links to Pet Product Pages tactics.
Assisted revenue: attribution windows and channel grouping
Adopt 30-90 day attribution windows in GA4. Group blog landing sessions under Organic Social/Organic Search appropriately. Use assisted revenue tracking to quantify multi-touch influence on product page sessions and purchases.
Content velocity: publish cadence vs. indexation and time-to-first-click
Measure posts published per week, indexation rate, and median days to first click. Watch diminishing returns when indexation lags. Tie content velocity analytics to crawl efficiency and the first-click curve by topic.
Event and attribution setup (GA4 + Search Console + eCommerce)
Configure a minimum viable analytics stack before scaling. GA4 event hygiene, UTM consistency, and Search Console mapping will determine whether lifts are provable and repeatable across product categories and countries.[1]
Required events: view_item_list, view_item, add_to_cart, begin_checkout, purchase
Implement GA4 retail events with product IDs, brand, category, and currency. Enrich with content_group and article slug. Capture promotions, coupon usage, and shipping selections to illuminate article-to-basket conversion paths.
UTM and content grouping structure for automated posts
Standardize utm_campaign by topic cluster, utm_content by article ID, and content_group by intent. Consider automating tagging through Petbase AI to reduce variance and ensure consistent measurement across scaled deployments.
Attribution views: data-driven, position-based, and time decay
Use GA4 Data-Driven as default. Compare with position-based (40/20/40) and time-decay to reveal mid-funnel influence. This triangulation supports more credible ROI narratives for organic content contributions.[3]
Search Console mapping to topic clusters and product pages
Map each URL to a topic cluster. Track query buckets per cluster and monitor internal link targets. Relate informational posts to downstream product pages to quantify topic-to-revenue pathways.
Monitoring cadence
Adopt a staged monitoring plan. Early signals reduce uncertainty, while quarterly cohorts confirm durable effects. Keep iteration light and reversible during the first eight weeks to avoid confounding attribution.
After 7-14 days: indexation, early impressions, and assisted micro-conversions
Verify indexation and rising impressions. Track scroll, outbound product clicks, and email signups. Investigate time-to-first-click outliers. Improve snippets and add internal links to capture early navigational interest.
After 4-8 weeks: stable rankings, click-through improvements, assisted revenue
Assess rank stability and CTR deltas. Examine assisted revenue gains via time-decay models. Strengthen above-the-fold CTAs and refine related product modules based on engaged session patterns and device-specific behavior.
Quarterly: cohort ROI by publish month and topic cluster
Aggregate sessions, conversions, and assisted revenue by publish cohort. Compare to holdouts. Reinvest in clusters with highest blended return and deprecate underperforming themes lacking engagement or monetization traction.

Practical safety boundaries
Guardrails limit downside while data matures. Use phased velocity, minimum viability thresholds, and topic risk controls. Evidence-based restraint may prevent algorithmic volatility and wasted crawl while improving editorial trust.
Maximum weekly publish rate before crawl waste and cannibalization
Cap at 2-4 posts per day per site section initially. Expand only when >80% indexation occurs within two weeks. Enforce unique primary keywords to avoid cannibalization between closely related intents.
Minimum traffic and conversion thresholds to keep articles live
Set a 60-90 day probation. If non-brand clicks stay under 50 and add-to-cart rate remains below 0.3%, consolidate or retarget. Preserve indexing equity by redirecting to the strongest closely matched URL.
Guardrails for medical or high-risk pet topics with review workflows
Require expert review, citational evidence, and schema for YMYL-adjacent topics. Employ a double-check editorial workflow before publishing. See Veterinary Blog Automation With E-E-A-T: Schema, Citations, and Review Flow for governance patterns.
Evidence status and expected effect sizes
Research supports SEO benefits from structured analytics and sustained optimization, while some attribution areas remain uncertain. Treat estimates as directional and validate with controlled experiments where feasible.[4]
What industry research suggests about content velocity and rankings
Evidence indicates consistent publishing and technical hygiene may support ranking gains, provided quality and intent match remain strong. Gains often occur gradually as topical authority compounds and internal links distribute equity.[4]
Where evidence is weaker: assisted conversions and long-tail lift
Attributing mid-funnel influence is inherently noisy. Models can disagree, and long-tail growth emerges slowly. Use multi-model comparisons and conservative assumptions when forecasting indirect returns from informational content.[2]
How to run A/B holdouts and difference-in-differences for stronger inference
Randomly hold back 10-20% of topics. Compare changes over time between treated and control sets. Apply difference-in-differences to adjust for seasonality and algorithm shifts affecting both groups.[2]
Reporting templates and benchmarks
Build a concise dashboard aligning teams around visibility, engagement, conversion, and revenue. Use directional ranges rather than absolutes early. Quantify how internal links accelerate discovery and monetize engaged sessions efficiently.
Dashboard blueprint: visibility, engagement, conversion, revenue
Include topic coverage, average rank, CTR, non-brand sessions, engaged sessions, micro-goals, add-to-cart rate, checkout starts, purchases, assisted revenue share, and cohort ROI by month and by topic cluster.
Benchmarks to track: CTR deltas, add-to-cart rate, assisted revenue share
Target CTR lift of 0.5-2.0 points after snippet tests. Aim for 1.0-2.5% add-to-cart from blog landings. Track assisted revenue share trending upward as internal links and familiarity compound over months.
Sample ROI calculation for a €199/month plan
If automation yields 1,500 incremental non-brand sessions, 1.5% add-to-cart, 40% checkout rate, and €30 AOV, projected monthly revenue approximates €270-€360. Net ROI likely improves as backlog compounds and optimization refines.
Integration with the measurement and optimization hub
This deep dive narrows to measurement of keyword gains, article-level conversions, assisted product revenue, and content velocity in automated environments. Use it alongside your governance, brief templates, and calendar planning. For templated catalogs and localization, connect measurement to repeatable production systems such as Programmatic SEO for Pet Catalogs: Safe Templates for Breeds, Sizes, and Life Stages and Multilingual Pet Blog Automation: US, UK, and DACH Localization when applicable. Tie velocity decisions back to calendar control patterns in How to Build a 30-Day Automated Pet Blog Calendar (Without Losing Control) to sustain quality while scaling.
Frequently Asked Questions
How long does it take to see ROI from pet blog automation?
Early indicators may appear within 2-4 weeks via impressions and micro-conversions. Clear revenue impact often needs 8-12 weeks as rankings stabilize and internal links compound.
What metrics matter most for automated pet blog content?
Evidence suggests tracking topic-level rankings, non-brand organic sessions, article-level conversions, assisted revenue, and content velocity provides a balanced view.
How do I measure assisted revenue from blog posts?
Use GA4 data-driven attribution with a 30-90 day window, segment blog landing pages, and review position-based or time-decay models to see contribution beyond last click.
How can I avoid cannibalization with high publish velocity?
Group keywords by intent, enforce unique primary terms per URL, and monitor overlap in Search Console. If impressions split across similar pages, consolidate or retarget.
What baseline should I set before turning on automation?
Capture 8-12 weeks of rankings, non-brand sessions, and conversion rates by topic cluster. Mark the automation start date and hold back 10-20% of topics as controls if possible.
Conclusion
Measuring ROI of pet blog automation requires disciplined structure, not guesswork. Prioritize a KPI hierarchy, consistent instrumentation, and cautious interpretation. Use pet SEO automation metrics to connect rankings, traffic, and article-level conversions to assisted revenue tracking. Iterate quickly but within safety boundaries. Over quarters, compounding improvements in keyword coverage and internal linking may yield defensible revenue lift. With a rigorous plan, automation evolves from output volume to predictable performance stewardship.
References
- S Okutan (2025). Search Engine Optimization (SEO) and Search Engine Marketing (SEM). Online Retail Marketing Strategy: Foundations and …. View article
- Q Björnfot et al. (2023). Comparing the Return on Investment of Search Engine Optimization and Pay-Per-Click marketing: Developing a model to forecast the ROI of SEO based on the …. 2023 - diva-portal.org. View article
- D Bansal (2024). How SEO and analytics are connected. International Journal For Multidisciplinary Research. View article
- S Das (2021). Search engine optimization and marketing: A recipe for success in digital marketing. 2021 - api.taylorfrancis.com. View article