SEO Analytics and ROI Tracking for Pet Retailers: Dashboards and Benchmarks
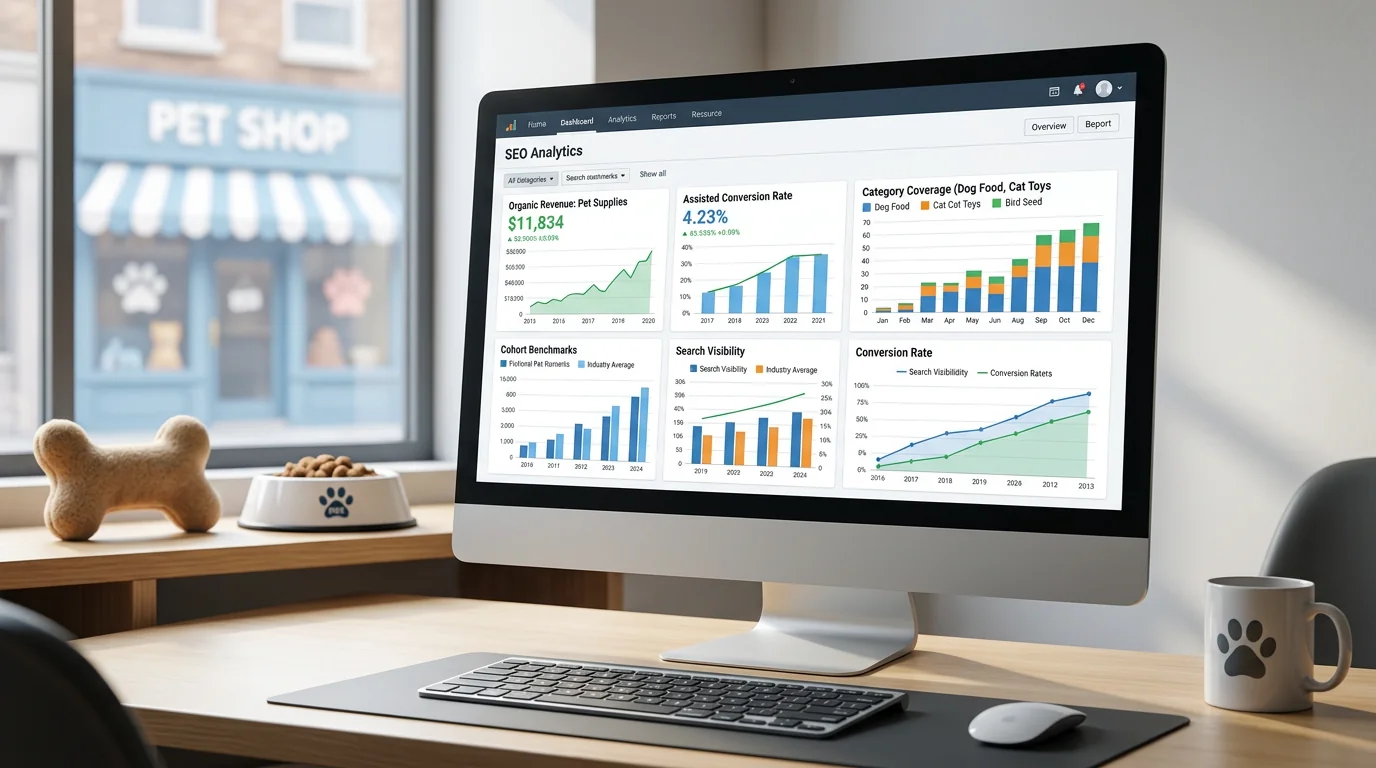
Table of Contents +
- Why measurement for pet retail SEO is different
- Core KPIs to track (definitions and formulas)
- Decision guide: if this, then measure that
- Dashboard setup: GA4, Search Console, and Looker Studio
- Benchmarks and cohorts for pet retailers
- Monitoring cadence: 7-14 days and 4-8 weeks
- Practical safety boundaries for interpretation
- Evidence status: what the data can and cannot claim
- Appendix: metric definitions and formulas
- Quick links to broader strategy context
- Frequently Asked Questions
- References
Define KPIs, build dashboards, and track ROI for pet retailers. Learn benchmarks, assisted conversions, and category coverage to guide SEO investment.
Measuring organic impact in pet retail is harder than it looks. Multi-intent searches, replenishment cycles, and product variants complicate attribution. Leaders need a clean, decision-ready framework.
This matters because budgets often shift to channels with clearer reporting. SEO can be undervalued without rigorous analytics. In this guide, you will learn pet-specific KPIs, a reliable dashboard build, and cohort benchmarks to evaluate SEO ROI. For prioritization context, see the Pet Store SEO strategy hub.
Why measurement for pet retail SEO is different
Mixed intent and product-led navigation
Shoppers arrive with mixed intent. Some compare brands, while others seek solutions for size, life stage, or conditions. Product-led navigation and filters change paths. Measurement should capture both discovery visits and high-intent product detail views.
Seasonality, breed/size modifiers, and local overlays
Demand shifts with seasons, promotions, and weather. Breed and size modifiers alter SKU relevance and pricing. Local overlays affect inventory and pickup availability. Your pet store SEO analytics must normalize these variables to avoid misleading conclusions.
Petbase automates SEO content for pet stores - publishing 10 optimized articles monthly so you can focus on running your shop - start your free trial.
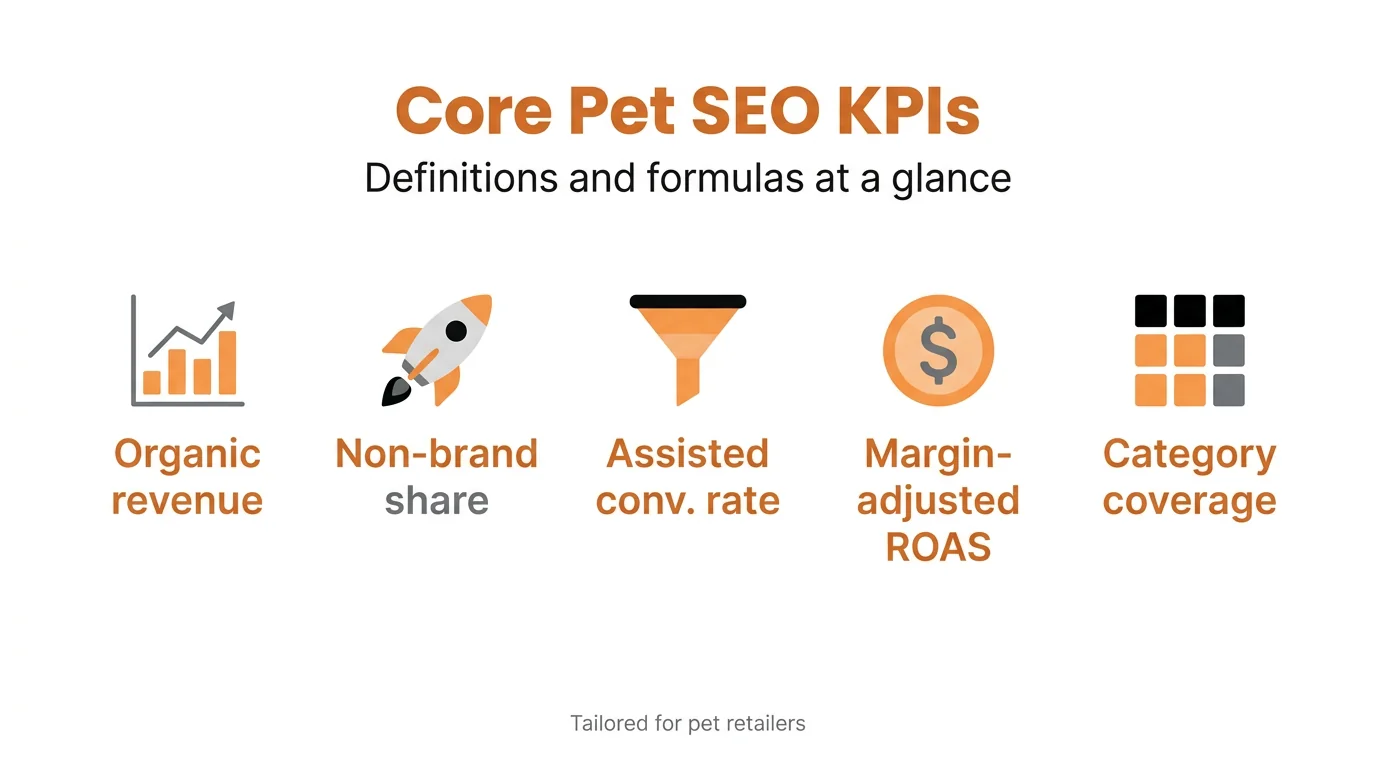
Core KPIs to track (definitions and formulas)
Organic revenue and margin-adjusted ROAS
Organic revenue is net sales attributed to organic search. Tie to order IDs and exclude shipping, tax, and refunds. Margin-adjusted ROAS = Gross margin from organic / content and SEO costs. Evidence suggests margin-level analysis better reflects operational reality[2].
Assisted conversion rate and view-through influence
Assisted conversion rate = Assisted conversions from organic / organic sessions. Consider “view-through” influence by modeling last non-direct click vs. data-driven attribution. Comparing the gap may indicate SEO’s contribution to multi-touch journeys[4].
Category coverage and SKU discoverability
Category coverage estimates how much of your taxonomy ranks for relevant modifiers. Track indexed pages, ranking keywords per category, and CTR. Improve depth with internal linking from blog to product pages to route topical authority toward key SKUs.
Non-brand to brand ratio and share of voice
Non-brand to brand ratio = Non-brand organic sessions / Total organic sessions. A healthy mix may indicate discoverability beyond your brand name. Share of voice tracks your ranking and CTR footprint vs. competitors across target terms.
Content velocity and indexation health
Content velocity = New SEO pages published per week. Indexation health = Indexed pages / Submitted pages. High velocity without indexing may waste effort. GA4 and Search Console evidence supports aligning content cadence with crawl-responsiveness[3].
Decision guide: if this, then measure that
Quick decision paths for common pet retail scenarios
- If traffic rises but revenue lags, segment by non-brand vs. brand. Measure product page entrances and assisted conversion rate.
- If rankings improve but CTR is flat, review category coverage and SERP features. Test titles and rich results.
- If one category outperforms, analyze SKU discoverability and internal links. Expand modifiers and related content clusters.
- If new content is slow to index, lower velocity. Improve sitemaps, canonicals, and submission timing. Track indexation health.
- If local pickup grows, separate local organic traffic. Assess inventory availability’s effect on conversions.
- If seasonality spikes category demand, compare to a season-adjusted baseline. Monitor non-brand ratio changes.
- If performance varies by device, evaluate mobile PDP speed and filters. Measure PDP engagement and add-to-cart rate.
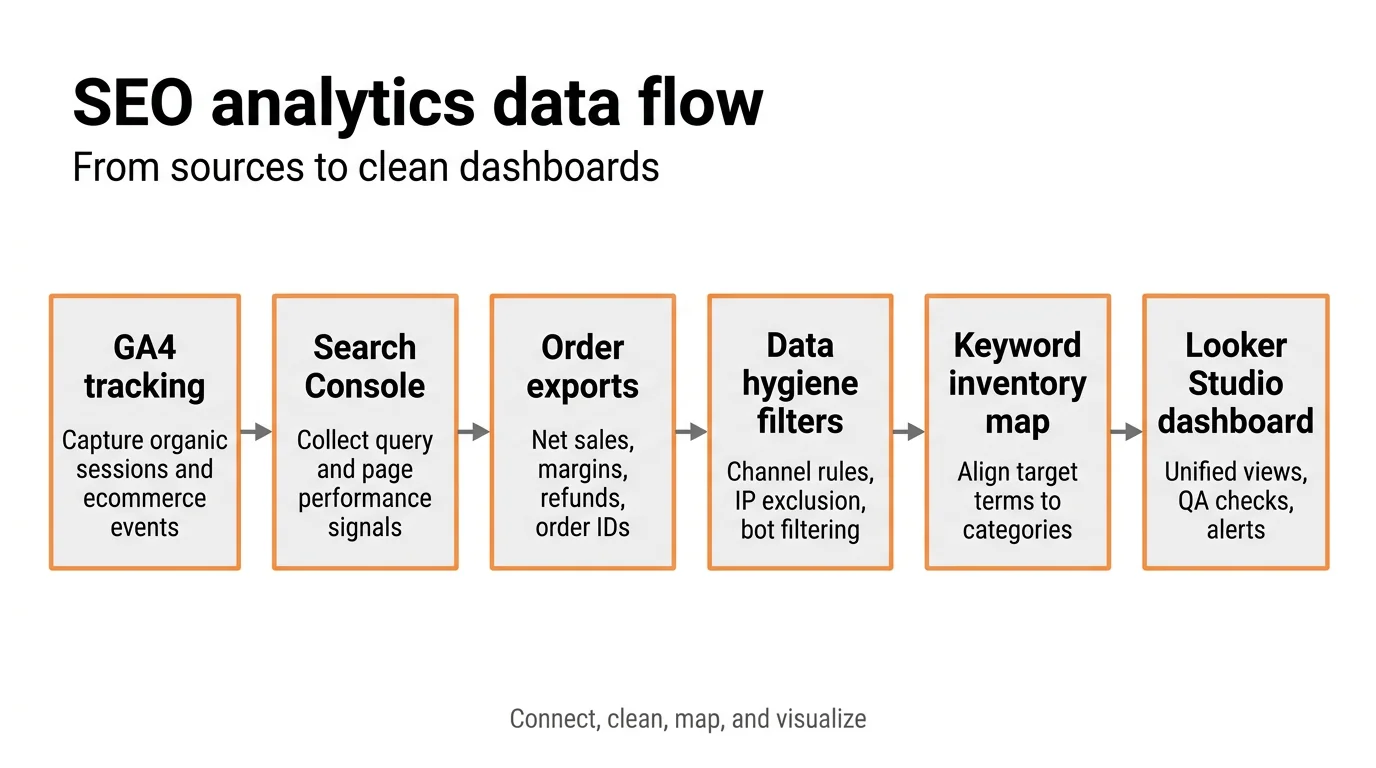
Dashboard setup: GA4, Search Console, and Looker Studio
Required data sources and filters
Connect GA4, Search Console, and ecommerce platform order exports. Filter organic search with channel group hygiene and exclude internal IPs. Build views for non-brand terms and category segments. This foundation powers reliable ecommerce SEO dashboards[3].
For input quality, map a keyword inventory from research. Consider aligning with automated keyword research for pet retailers to keep target terms current and measurable by category.
Essential widgets and calculated fields
Essential widgets include Organic revenue, Margin-adjusted ROAS, Assisted conversions, Non-brand ratio, Category coverage, Indexation, and Content velocity. Add calculated fields for margin, SKU discoverability, and page-type conversion rate. Evidence suggests consistent KPI scaffolding eases ROI evaluation[2].
Attribution settings and channel hygiene
In GA4, use data-driven attribution and compare with last click for sensitivity. Ensure “organic search” excludes affiliates, coupons, and meta search referrers. For scalable content-to-analytics alignment, teams sometimes use Petbase AI to standardize page templates and tagging across categories.
Benchmarks and cohorts for pet retailers
Early, growth, and mature stage KPI ranges
Indicative early-stage ranges: 10-25% non-brand mix, 0.5-1.5% assisted conversion rate, 30-55% category coverage benchmark by top categories. Growth-stage may reach 25-45% non-brand, 1.5-3.0% assisted rate, and 55-75% coverage. Mature programs may exceed 45% non-brand with stable margins.
Category-specific patterns (food, toys, health, services)
Food often shows higher repeat revenue with strong brand terms. Toys skew toward non-brand discovery and seasonal bursts. Health sees longer consideration with higher assistance. Services require local overlays and appointment conversions. Explore cohort tactics like programmatic SEO for pet catalogs to scale modifiers.
Monitoring cadence: 7-14 days and 4-8 weeks
Short-cycle checks and error budgets
In 7-14 days, verify crawl and indexation, schema errors, and CTR anomalies. Set an error budget for broken PDP links and filters. Early signals rarely prove ROI but can flag misattribution and technical blockers[3].
Medium-cycle trend validation and prioritization
Across 4-8 weeks, compare data-driven vs. last-click revenue, monitor non-brand ratio shifts, and validate assisted conversion trends. This window may smooth crawl volatility and seasonal noise for directional decisions[4].
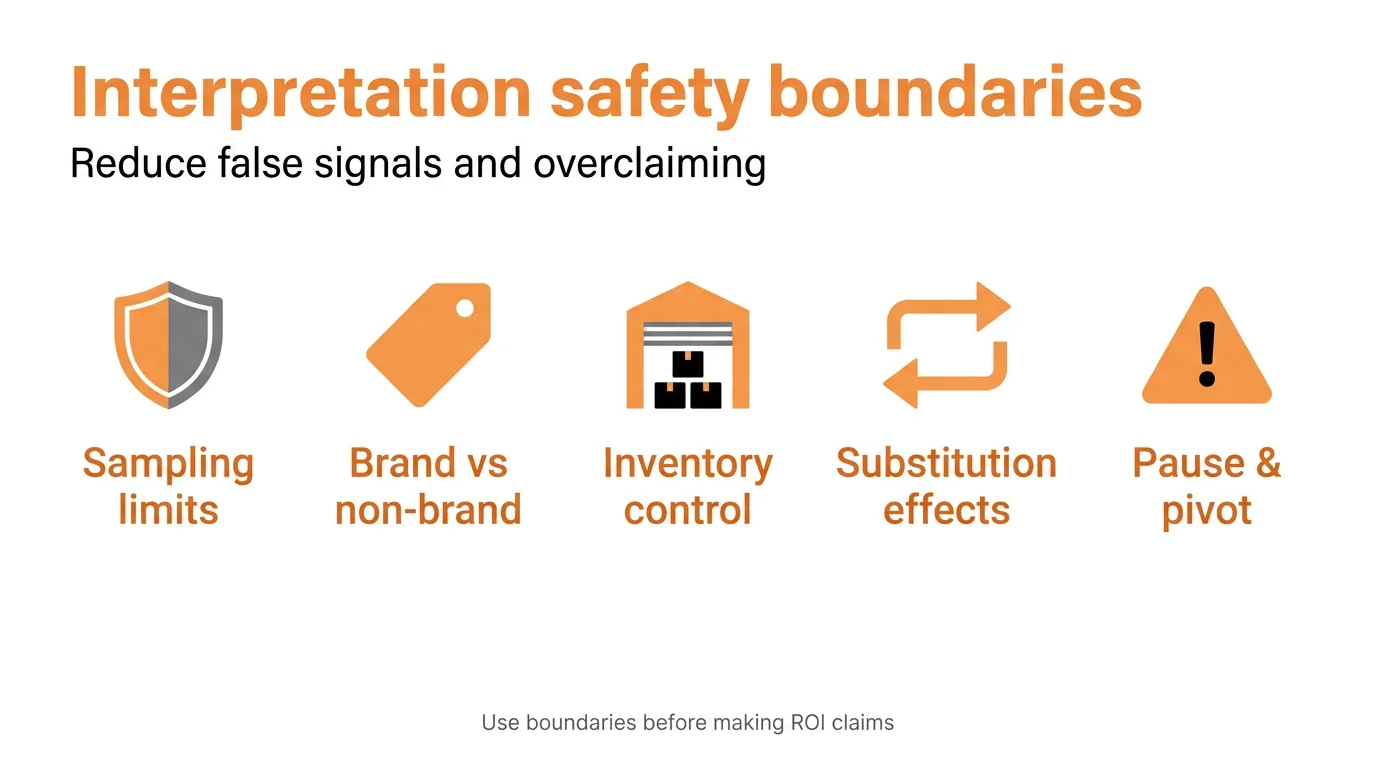
Practical safety boundaries for interpretation
Sampling, cannibalization, and inventory confounders
Beware sampling and thresholding in GA4 reports. Separate brand vs. non-brand cohorts to detect cannibalization. Control for inventory levels, substitutions, and price changes, which may distort organic revenue attribution and conversion rates.
When to pause, pivot, or extend test windows
Pause if indexation deteriorates or if major PDP quality issues persist. Pivot if non-brand traffic grows but assisted conversion rate declines materially. Extend windows when seasonality or stockouts overlap with tests, masking outcomes.
Evidence status: what the data can and cannot claim
Attribution caveats and causality considerations
Attribution estimates contribution, not causality. Data-driven models improve signal but remain probabilistic. Studies note SEO ROI may trail PPC early yet compound over time, complicating direct comparisons[4]. GA-driven insights support decisions but require triangulation with business context[3]. AI-enabled processes can enhance forecasting and scale, with careful validation[1].
Appendix: metric definitions and formulas
Field list and calculation notes
- Organic revenue = Sum(order revenue) where Default Channel Group = Organic Search; exclude tax, shipping, refunds.
- Gross margin = Revenue × (1 - COGS%); Margin-adjusted ROAS = Gross margin / SEO program cost.
- Assisted conversions = GA4 assisted conversions for Organic; Assisted conversion rate = Assisted conversions / Organic sessions.
- View-through influence = Data-driven revenue - Last-click revenue for Organic; interpret as indicative, not causal.
- Category coverage = Ranking keywords per category ÷ Target keywords per category; SKU discoverability = Product PDP entrances from non-brand ÷ Total PDP entrances.
- Non-brand to brand ratio = Non-brand organic sessions ÷ Total organic sessions; define brand variants carefully.
- Share of voice = Weighted average CTR × Impression share across tracked terms.
- Content velocity = New indexable pages published per week; Indexation health = Indexed pages ÷ Submitted pages.
- Channel hygiene rules: includeHostnames, exclude Internal IPs, map affiliates to Affiliate not Organic, normalize UTM sources.
- Category taxonomy alignment: ensure keywords mirror site architecture and modifiers; align with internal linking and schema.
Quick links to broader strategy context
Where this fits in your Pet Store SEO roadmap
Use this dashboard and KPI framework to decide where to invest in content, technical, and category expansion. For schema, multilingual, and seasonal execution patterns, extend your roadmap after establishing stable measurement baselines.
Frequently Asked Questions
What KPIs matter most for pet retailer SEO?
Evidence suggests focusing on organic revenue, assisted conversion rate, category coverage, non-brand share, and content indexation. These metrics may reflect both discovery and purchase influence across the funnel.
How do I attribute SEO revenue in GA4?
Use GA4 Explorations with a data-driven model and organic search as the primary channel. Compare last click vs. data-driven to estimate assisted impact, and validate with branded search lift and landing page cohorts.
What is category coverage in SEO?
Category coverage estimates how much of your catalog and key modifiers (breed, size, life stage) are discoverable via organic search. Track indexed pages, ranking keywords per category, and CTR to spot gaps.
How often should I update my SEO dashboard?
Weekly checks may catch anomalies, while monthly rollups may better show trend direction. For tests, a 4-8 week window often helps to smooth seasonality and crawling variability.
What benchmarks are realistic for new pet stores?
Indicative early-stage ranges may include 10-25% non-brand organic traffic mix and 0.5-1.5% assisted conversion rate. Results vary by assortment depth, technical health, and content velocity.
Implementation tip: Align dashboards with your taxonomy, modifiers, and page templates first. Then scale content and internal links to grow non-brand visibility and revenue influence.
References
- R Hasan (2025). Enhancing Market Competitiveness Through AI-Powered SEO And Digital Marketing Strategies In E-Commerce. ASRC Procedia: Global Perspectives in …. View article
- L Sampath (2024). Digital marketing metrics and ROI analysis: Evaluating effectiveness and value. Journal of Research in Business and Management. View article
- MR Mohaimin (2025). The Influence of Google Analytics on E-commerce: Enhancing Customer Insights and Business Performance. Journal of Business and Management Studies. View article
- Q Björnfot et al. (2023). Comparing the Return on Investment of Search Engine Optimization and Pay-Per-Click marketing: Developing a model to forecast the ROI of SEO based on the …. 2023 - diva-portal.org. View article