Pet SEO Analytics: KPI Tree, Dashboards, and ROI Modeling for Content and Catalog

Table of Contents +
- Why Pet SEO Analytics Needs Its Own KPI Tree
- The Pet SEO KPI Tree: From Impressions to Revenue
- Attribution Models for Pet Products and Services
- Dashboards That Tie Petbase Outputs to ROI
- ROI Modeling for Content and Catalog at Different Scales
- Measurement for Key Pet Segments
- Implementation Blueprint: Events, Schema, and Data Plumbing
- Reporting Cadence and Governance
- Common Pitfalls and How to Avoid Them
- Resources and Next Steps
- Frequently Asked Questions
- Conclusion
- References
Build a Pet SEO KPI tree, unify dashboards, and model ROI from content and catalog. Track impressions-to-revenue and attribute value across products & services.
What you measure determines what you scale. In pet SEO analytics, that truth is magnified by complex catalogs, service funnels, and long consideration cycles. This article defines a practical KPI hierarchy, attribution approaches for products and services, and dashboard blueprints that connect outputs to actual revenue and margin.
We will move from impressions to LTV, show how to connect content assists to SKU revenue, and operationalize dashboards that quantify ROI. By the end, you can rebuild your analytics around business outcomes, not vanity metrics.
Why Pet SEO Analytics Needs Its Own KPI Tree
Pet-industry funnels combine product catalogs, service bookings, and affiliate flows. A dedicated KPI tree aligns pet SEO KPIs to revenue and margin. For foundations, see our end-to-end Pet SEO guide before building measurement.
Measure what moves margin, not merely what moves rankings.
The pet-industry funnel: searcher intent to lifetime value
Intent starts with queries, evolves into research, then purchase or booking. Post-purchase behavior drives repeat orders and referrals. Your KPI tree must connect each stage to retention and lifetime value.
Mapping unique pet verticals: products vs. services vs. affiliates
Products need SKU-level revenue; services require bookings and lead valuation. Affiliates depend on outbound clicks and commissions. Keep models separate, then roll them into a unified executive view.
From vanity to value: choosing outcomes over outputs
Rankings and traffic are outputs. Revenue, margin, and payback are outcomes. Build accountability by laddering outputs upward, enforcing ownership of each conversion step’s contribution.
Petbase automates SEO content for pet stores - publishing 10 optimized articles monthly so you can focus on running your shop - start your free trial.
The Pet SEO KPI Tree: From Impressions to Revenue
Structure your metrics as a cascading system, not a flat list. This turns diagnostics into decisions and prioritizes fixes by revenue impact.
Top-of-funnel: queries, impressions, and SERP features
Track queries mapped to intent clusters, impressions by topic, and SERP features won. SERP context shapes click potential, elevating rich results in competitive spaces.[3]
Mid-funnel: clicks, sessions, engagement, and assists
Monitor clicks, sessions, scroll depth, and time-on-page. Attribute assists when content visitors progress to PDPs or service pages. Use pathing to analyze internal link performance and conversion lift.
Bottom-funnel: add-to-cart, lead events, conversion rate
Measure add-to-cart, checkout starts, and completed transactions. For services, capture form submits, calls, and bookings. Segment by content entry to isolate content-driven conversion efficiency.
Revenue layer: AOV, margin, LTV, and payback
Quantify revenue with AOV and margin, then add LTV and payback days. Tie back to originating content, category pages, and PDPs to prove economic value chain.

Attribution Models for Pet Products and Services
Use attribution that reflects real journeys. Blend models by channel maturity, catalog complexity, and sales cycle length for robust catalog attribution.
Single vs. multi-touch: when to use each in pet retail
Last-click helps tactical SKU decisions. Multi-touch captures blog and category assists in research-heavy paths. Use both for reporting: operational last-click and strategic multi-touch views.
Content-assisted conversions: blog-to-product journeys
Track internal link clicks, session stitching, and PDP landings from articles. Attribute shared revenue with assist credit windows. Highlight categories where informational content reduces acquisition costs.
Local and services: phone, form, and booking attribution
Implement call tracking, form source fields, and booking IDs. Join leads to closed revenue using CRM. Weight multi-location performance by market size and service availability.
Affiliate and marketplace leakage: tracking workarounds
Monitor outbound clicks, affiliate IDs, and coupon usage. Estimate assisted sales from marketplace overlaps. For SKU-level schema and tracking, review our product-page SEO resources.
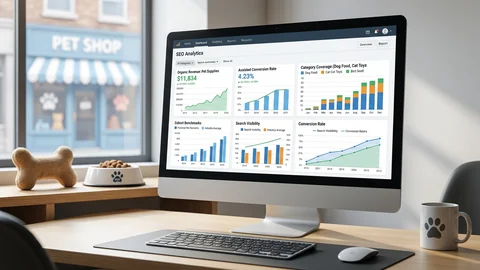
Dashboards That Tie Petbase Outputs to ROI
Dashboards must be decision tools, not data wallpaper. Build SEO dashboards for pet brands that answer “what moved revenue this week?” and “where to allocate next?”
Source-of-truth schema: content, SKU, and service IDs
Create a shared ID dictionary. Every article, SKU, and service must carry stable IDs across Search Console, Analytics, and commerce systems. This is non-negotiable for reliable joins.
Essential widgets: KPI tree tiles, cohorts, and paths
Include tiles for impressions, clicks, assists, and revenue. Add entry-cohort performance and path visualizations. Keep layouts simple, responsive, and aligned with decisions.
- KPI tiles
- Cohorts
- Paths
Blending Search Console, Analytics, and commerce data
Join query-level data to session and order tables using IDs and timestamps. Big data joins surface causal patterns obscured in siloed tools.[1]
QA and alerting: anomaly detection for content and catalog
Set alerts for index drops, CTR shocks, and conversion cliffs. Validate schema, price, and stock feeds. Teams automating product-linked articles can feed outputs from Start Now directly into these dashboards.
ROI Modeling for Content and Catalog at Different Scales
Content ROI modeling translates pet eCommerce SEO metrics into finance-ready forecasts. Start small, validate assumptions, then scale to portfolios.
Unit economics per article and per SKU
Model cost, traffic, conversion rate, AOV, and margin per unit. Standardize templates for repeatability. Keep assumptions documented and versioned.
| Metric | Example |
|---|---|
| Article cost | $180 |
| SKU margin / AOV | 35% / $60 |
Forecasting: traffic, CTR, and conversion assumptions
Estimate traffic using ranking targets and CTR curves. Calibrate with historical category data and difficulty. Keyword strategy shapes durable returns; plan for compounding effects.[2]
Sensitivity analysis: seasonality, price, and stockouts
Run upside/base/downside scenarios. Adjust for seasonal demand, price elasticity, and inventory gaps. Report confidence intervals to set realistic executive expectations.
Prioritization: ICE/RICE scores with margin weighting
Score initiatives by Impact, Confidence, and Effort. Add Reach for RICE. Weight by contribution margin to elevate profitable, scalable themes and SKUs.

Measurement for Key Pet Segments
Measurement nuances vary by segment. Tune KPIs for clarity, then roll up consistently.
Retail/eCommerce: bundles, sizes, breeds, life stages
Segment revenue by bundle, size, and life stage attributes. Attribute cross-sell and upsell flows. Use variant-level IDs to preserve accuracy across merchandising changes.
Veterinary and services: localized intent and E-E-A-T signals
Track local queries, service intent, and medical authority indicators. Strengthen E-E-A-T with author credentials and citations. Evidence-driven structure correlates with trust and visibility.[4]
Multi-language programs: country folders and data splits
Split data by country folders and language. Normalize currency and margins before rollups. For workflows, see localization and regionalization guidance.
Content affiliates: compliance and conversion proxies
Monitor outbound clicks, EPC, and partner policy compliance. Use coupon redemption and postback data as proxies. Reconcile monthly for payment integrity.
Implementation Blueprint: Events, Schema, and Data Plumbing
Instrument once, then automate. The blueprint below aligns events and IDs across all surfaces.
Event naming: content view, PDP view, add-to-cart, book, call
Standardize: content_view, pdp_view, add_to_cart, checkout_start, purchase, form_submit, call_click, booking_confirm. Enforce consistent properties: content_id, sku_id, service_id, revenue, margin_estimate.
Product and service schema: required fields and IDs
Deploy Product and Service schema with sku, gtin, brand, availability, price, areaServed. Include content_id on articles referencing SKUs or services to enable assist joins.
Internal linking UTM-like parameters for assist analysis
Append params to internal links: src=content_id, tgt=sku_id/service_id, pos=module. Use short hashes to avoid indexation issues. Persist across sessions when possible.
How to instrument Petbase automation outputs in dashboards
Map automation outputs to ID dictionaries, enforce schema, and stream events. For setup workflows, see how to instrument Petbase automation outputs in dashboards with governance safeguards.
Reporting Cadence and Governance
Crisp cadence creates momentum. Governance preserves data trust as programs scale.
Weekly vs. monthly: what to watch and why
Weekly: anomalies, indexation, CTR shifts, and conversion cliffs. Monthly: cohort trends, LTV, margin, and payback. Keep executive summaries outcome-focused.
Post-publication QA and content refresh criteria
QA titles, schema, and links at 72 hours. Refresh content when rankings plateau, CTR declines, or competitors leapfrog. Align updates to peak demand windows.
Executive rollups: cost-to-revenue and payback windows
Report cost, revenue, gross margin, and payback in cohorts. Separate content, category, and SKU effects. Highlight compounding impact from evergreen topics.

Common Pitfalls and How to Avoid Them
Avoid patterns that inflate activity while depressing outcomes.
Counting clicks without measuring assisted value
Clicks without assist paths underreport content’s role. Add multi-touch at minimum. Make assists visible in weekly dashboards.
Missing SKU/service IDs in content analytics
Lacking IDs breaks joins and masks ROI. Enforce ID dictionaries. Block deployments missing identifiers.
Ignoring seasonality and breed-specific intent
Seasonality skews forecasts. Normalize baselines. Build intent models that respect variant attributes and calendar effects.
Over-automating without outcome feedback loops
Automation amplifies errors. Wire dashboards to margin-based decisions. Halt or adapt when payback windows drift.
Resources and Next Steps
Continue your analytics build with these deep dives.
Foundations: link to the end-to-end Pet SEO guide
Establish strategy, architecture, and governance before scaling measurement. Consult our core playbook in the end-to-end Pet SEO guide to align teams.
Deep dive: analyze internal link performance and conversion lift
Strengthen content-to-PDP journeys and quantify assists. Use this tutorial to analyze internal link performance and conversion lift with reproducible methods.
How to instrument Petbase automation outputs in dashboards
Operationalize analytics for AI content at scale. Learn how to instrument Petbase automation outputs in dashboards with ID hygiene, QA, and alerts.
Frequently Asked Questions
What KPIs should a pet brand track for SEO beyond traffic?
Track a KPI tree that rolls up from impressions and CTR to add-to-cart or lead events, then revenue, margin, and payback/LTV. Include assisted conversions from content to product or service pages.
How do I attribute revenue from blog posts to product sales?
Use content-to-PDP path analysis, tag internal links with parameters, and implement multi-touch models. Report both last-click and assisted revenue to capture true content impact.
What dashboards are essential for pet eCommerce SEO?
Combine Search Console for queries/CTR with Analytics and commerce data for conversion and revenue. Include KPI tree tiles, cohort performance, assist paths, and anomaly alerts.
How do I model ROI for SEO content in the pet industry?
Estimate traffic from keyword difficulty and CTR curves, apply on-site conversion rates and AOV/margin, and run sensitivity tests for seasonality, stockouts, and price changes.
How is veterinary or service SEO measurement different from retail?
Focus on local intent, calls, forms, and bookings as primary conversions. Use call tracking, form attribution, and location schema; value leads using close rates and average case value.
Conclusion
Pet SEO analytics is not a stack of graphs; it is a disciplined system that connects content and catalog to margin and LTV. Build a KPI tree from impressions to revenue, select attribution that reflects real journeys, and deploy dashboards that drive weekly decisions. With rigorous IDs, QA, and ROI modeling, pet brands can prioritize the work that pays back fastest and compounds. Adopt this framework, and your analytics will finally tell a clear, credible story the entire organization can act on.
References
- IC Drivas et al. (2020). Big data analytics for search engine optimization. Big Data and Cognitive …. View article
- A Erdmann et al. (2022). Search engine optimization: The long-term strategy of keyword choice. Journal of Business Research. View article
- D Lewandowski et al. (2021). The influence of search engine optimization on Google's results: A multi-dimensional approach for detecting SEO. Proceedings of the 13th ACM Web …. View article
- F Almukhtar et al. (2021). Search engine optimization: a review. Applied computer …. View article