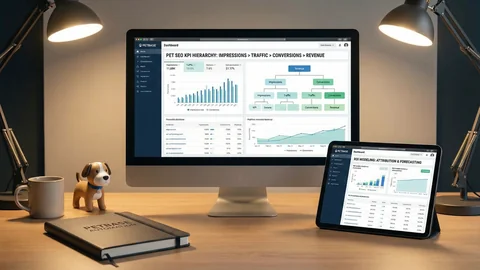
Proving ROI with KPIs and Dashboards for AI Content in Pet eCommerce
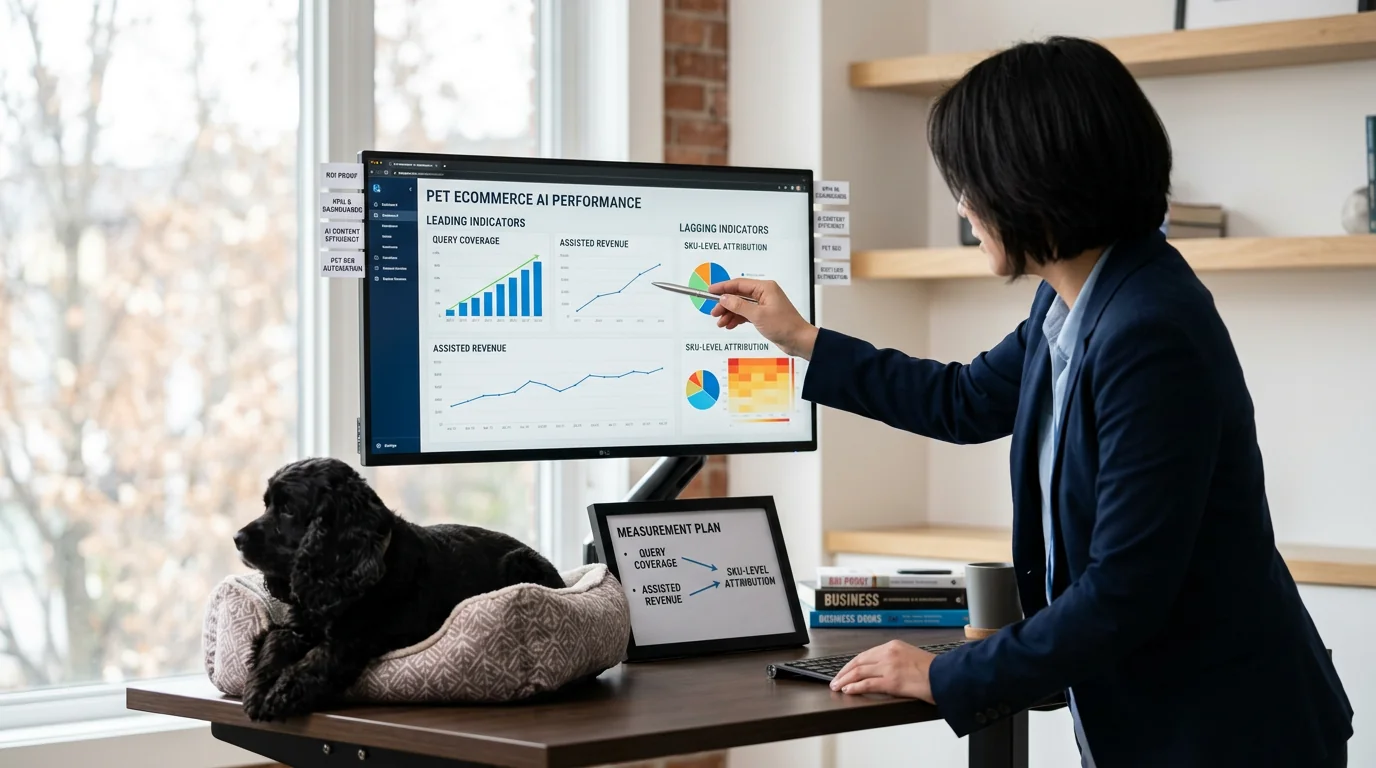
Table of Contents +
- Context: One decision-how to prove AI content ROI in a pet store catalog
- Measurement plan: leading vs. lagging indicators for pet eCommerce
- KPI set tailored to pet catalogs (breeds, life stages, conditions)
- Dashboard blueprint: from data sources to weekly views
- Quick decision guide
- Monitoring guidance: what to observe at 7-14 days and 4-8 weeks
- Practical safety boundaries for measurement and attribution
- Evidence status: what current data suggests
- How Petbase operationalizes these KPIs for pet brands
- Frequently Asked Questions
- Conclusion
- References
See how pet eCommerce teams track AI content ROI with KPIs, leading/lagging metrics, and SKU-level dashboards that may link content to assisted revenue.
Executives want proof that AI content drives revenue, not just traffic. Your analytics must translate content activity into commercial impact across the catalog.
This matters because pet eCommerce margins are tight and assortments are complex. You will learn a practical measurement plan using leading and lagging indicators, with clear thresholds and SKU-level attribution that aligns content effort with revenue.
Context: One decision-how to prove AI content ROI in a pet store catalog
Define the scope: blog, product pages, and collection pages
Start by limiting scope to three surfaces: educational blog articles, product detail pages, and collection or category pages. Treat each surface as a distinct content type with different intent, conversion paths, and KPIs.
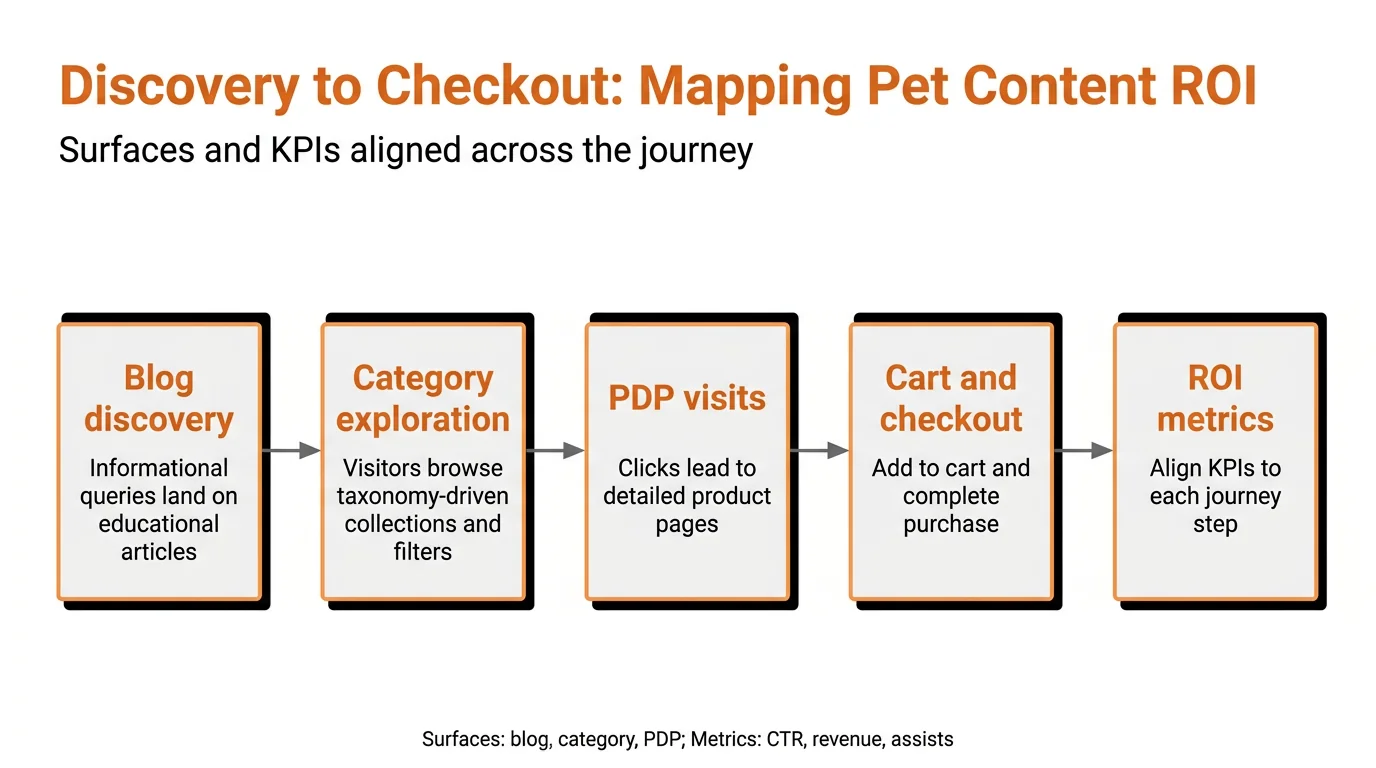
Map revenue influence: discovery → assist → last click
Model the journey as discovery via informational queries, assist via product exploration, and last click at checkout. Align metrics to each step so your AI content ROI narrative connects impressions to revenue influence, then to purchases.
Petbase writes and publishes this kind of content automatically - 10 SEO articles per month for pet businesses - start your free trial.
Measurement plan: leading vs. lagging indicators for pet eCommerce
Leading indicators: query coverage, crawlability, SERP presence
Track query coverage metrics, indexation, and first-positioning impressions. Evidence suggests predictive signals like these may forecast downstream ROI when integrated into planning and optimization loops.[1]
Middle-funnel indicators: engaged sessions, PDP click-through, list signups
Measure engaged sessions, scroll depth to product modules, PDP click-through rate, and newsletter signups. These signals often validate topical resonance and merchandising alignment before revenue appears in analytics.
Lagging indicators: assisted revenue, last-click revenue, LTV cohorts
Use assisted revenue attribution alongside last-click revenue and early LTV cohorts. A dual view aligns with enterprise ROI frameworks that weigh intermediate impact, not only terminal conversions.[2]
KPI set tailored to pet catalogs (breeds, life stages, conditions)
Query coverage by taxonomy: breed, size, life stage, condition
Organize pet eCommerce KPIs by taxonomy. Set targets for query coverage within breed, size, life stage, and condition clusters. Aim for 60-80% coverage in priority clusters before investing in authority expansion.
Content-to-SKU mapping rate and internal link depth
Track the percentage of articles mapped to at least three relevant SKUs and the average internal link depth. Strong product-led mapping supports intent bridges from education to purchase pathways.Product-Led SEO: Mapping Breed, Size, and Life-Stage Queries to Pet SKUs
PDP uplift from content entrances
Measure PDP sessions and revenue from content entrances relative to baseline. A 10-25% uplift over four to eight weeks may indicate effective handoffs from content to product detail exploration.
Revenue attribution: assisted vs. last-click splits
Report assisted revenue attribution alongside last-click revenue splits. A healthy pattern shows assists rising first, then last-click catching up once ranking stabilizes and PDPs resolve key purchase anxieties.
Inventory-aware metrics: out-of-stock loss and substitution
Include out-of-stock loss estimates and substitution rates. When high-assist SKUs are unavailable, calculate lost contribution and note viable alternates to inform merchandising and content prioritization decisions.
Dashboard blueprint: from data sources to weekly views
Data sources: GSC, GA4, eCommerce platform, SKU feed
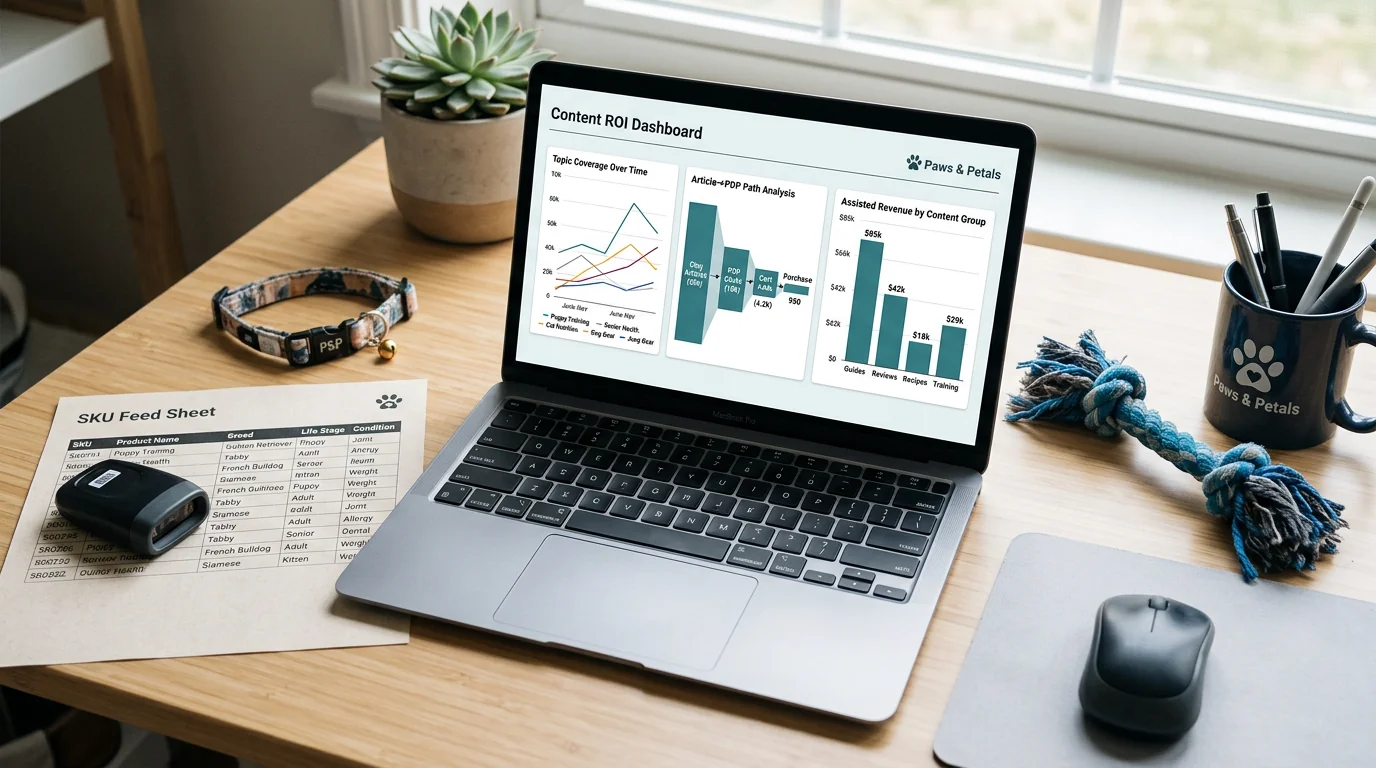
Build a content ROI dashboard from Google Search Console, GA4, your eCommerce platform, and a live SKU feed. Evidence suggests selecting concise, ROI-relevant inputs reduces analysis overhead and improves actionability.[3]
Core widgets: topic coverage, path analysis, assisted revenue
Use widgets for topic coverage over time, path analysis from article to PDP, and assisted revenue by content groups. Reinforce discovery-to-purchase narratives with funnel overlays and intent-segment comparisons.
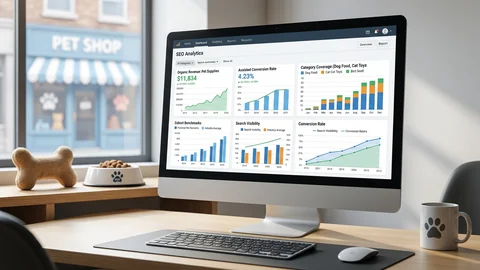
SKU-level panels: top assisted SKUs, margin view, stock status
Create SKU-level attribution panels showing top assisted SKUs, gross margin, and stock status. For cross-link strategy implementation, see From Blog to Basket: Internal Linking Blueprints for Pet eCommerce and Programmatic SEO for Large Pet Catalogs: Safe Templates by Breed and Use-Case.
Quick decision guide
If query coverage is <40% in a category, expand briefs before link building
Increase briefs and draft volume for that cluster. Build coverage to at least 60% so Google recognizes breadth before investing effort in outreach or authority amplification tactics.
If CTR <2% on informational terms, test titles/snippets and FAQ schema
Iterate meta titles, descriptions, and FAQ schema. Include sharper benefits and specific taxonomy terms. Re-evaluate in two weeks to confirm SERP snippet improvements and click movement.
If engaged sessions rise but PDP clicks stall, strengthen in-article product blocks
Refine product modules with clearer use-cases, comparison tables, and trust elements. Raise placement above the fold on mobile and add contextual internal links near high-engagement paragraphs.
If assisted revenue grows without last-click, keep nurturing paths and improve PDPs
Maintain educational cadence while enhancing PDP clarity. Address shipping, sizing, and compatibility questions. Stabilize reviews and FAQs to convert assist-driven traffic into last-click revenue.
If SKUs with high assists often OOS, prioritize inventory sync and alternates
Automate inventory checks in content modules. Promote substitutes with comparable attributes and healthy margins. Escalate replenishment or shift demand to in-stock, seasonally relevant SKUs.
If pages rank but bounce on mobile, audit speed, CWV, and UX patterns
Run Core Web Vitals diagnostics. Compress images, defer non-critical scripts, and simplify page templates. Validate tap targets and in-article navigation to reduce pogo-sticking.
If margin on assisted SKUs is thin, adjust merchandising and content targets
Rebalance briefs toward higher-margin categories without sacrificing relevance. Update internal links to highlight profitable alternates that still satisfy searcher intent and buyer needs.
Monitoring guidance: what to observe at 7-14 days and 4-8 weeks
7-14 days: indexing, impressions, scroll depth, PDP click-through
Confirm fast indexing and rising impressions. Watch scroll depth around product modules and early PDP click-through. These early signals guide content trims, snippet tests, and module repositioning.
4-8 weeks: ranking movement, assisted revenue, SKU coverage deltas
Evaluate rank changes on head and long-tail terms. Track assisted revenue lift and SKU-level attribution trends. Expand briefs where coverage lags and strengthen internal links based on navigational path data.
Practical safety boundaries for measurement and attribution
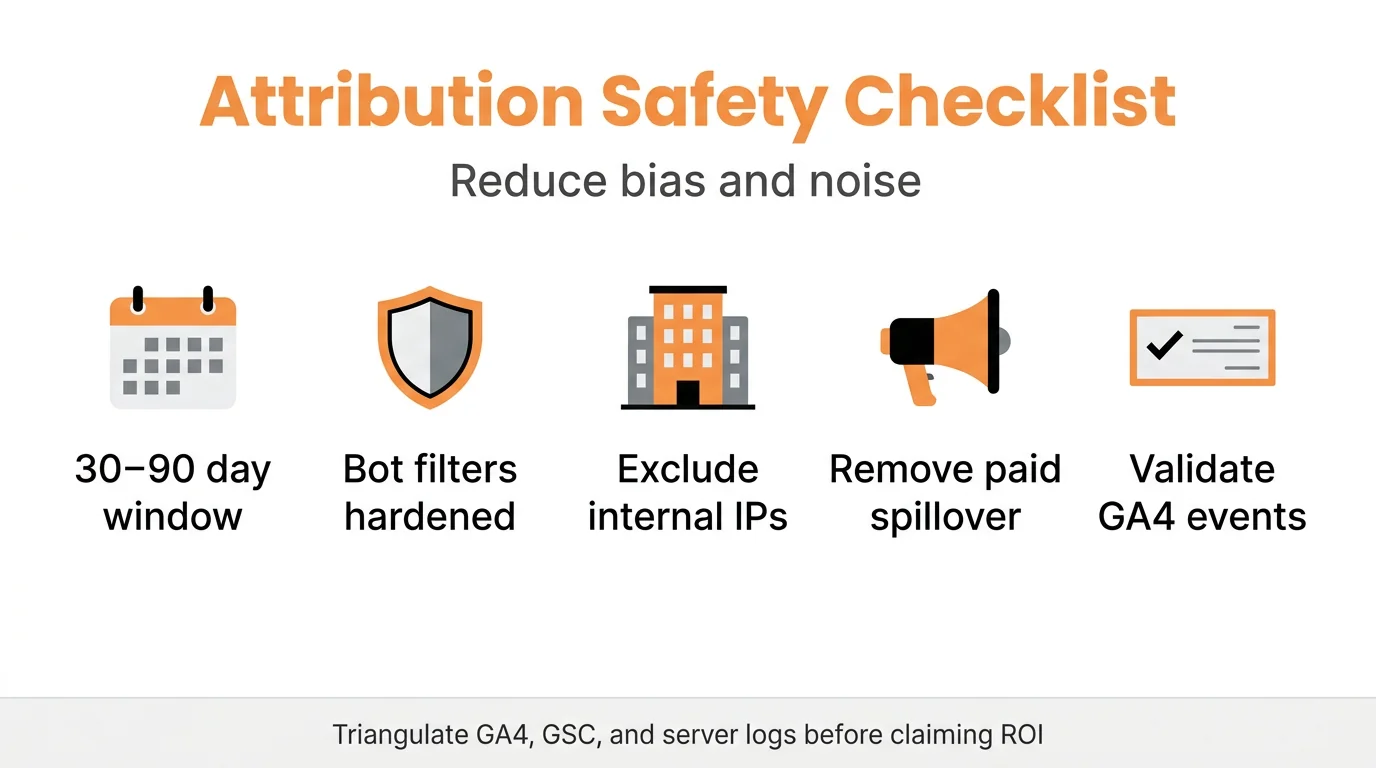
Attribution windows and lookback limits
Use a 30-90 day lookback depending on purchase cycle length. Periodically test alternative windows to gauge sensitivity and reduce overfitting in ROI narratives for executive decisions.[4]
Traffic quality and bot filtering safeguards
Harden filters for bots, internal IPs, and paid brand spillover. Validate GA4 events against server logs when possible. Trust AI content ROI only after hygiene excludes artificial or low-quality traffic.
SKU mapping hygiene and UTM governance
Enforce unique SKU IDs across feeds and content modules. Standardize UTMs for article cohorts. Clean mapping avoids attribution drift and supports comparable tests across taxonomy clusters.[2]
Avoiding over-attribution to thin content
Set minimum thresholds for word count, originality, and on-page expertise. Evidence suggests ROI discipline improves when investments favor robust assets over thin pages with transient ranking spikes.[3]
Evidence status: what current data suggests
Leading indicators may forecast revenue with lags
Query coverage and early SERP presence can forecast revenue with multi-week lags, particularly when predictive analytics guide content prioritization and iteration loops.[1]
Internal linking often correlates with PDP entrances
Structured internal links from topic hubs to PDPs frequently correlate with more PDP entrances and longer engaged sessions, supporting stronger intent bridges and measurable assists.
Schema enhancements may support higher CTR on pet queries
FAQ and HowTo schema may support incremental CTR gains on informational intent queries. Gains vary by SERP composition and authority, so test schemas alongside title and snippet experiments.
Limitations: seasonal swings, breed-specific volatility
Expect seasonality and taxonomy volatility to mask short-term performance. Use four to eight week windows, cohort views, and rolling averages to smooth noise before drawing conclusions.
How Petbase operationalizes these KPIs for pet brands
Automated query coverage tracking by pet taxonomy
Automate coverage tracking by breed, size, life stage, and condition. Use alerts when coverage falls below target so briefs and outlines expand before authority-building begins.
Content-to-product linking and SKU panels
Standardize content-to-SKU modules with taxonomy-aware recommendations, stock status, and margin flags. Teams may use Petbase AI to generate briefs, draft pages, and maintain SKU-level attribution pipelines automatically.
Dashboards aligning content cadence to revenue signals
Adopt weekly dashboards featuring query coverage metrics, engaged sessions, assisted revenue, and SKU-level attribution. Align publishing cadence with revenue signals rather than fixed editorial quotas.
Where to explore next: AI Content for Pet Brands: Strategy, Priorities, and Playbooks
Extend this measurement plan into topic selection and content architecture. Use taxonomy planning, internal linking patterns, and SKU targeting to scale results from early wins to durable growth.
Frequently Asked Questions
What KPIs best reflect AI content ROI for pet eCommerce?
Useful KPIs include query coverage by taxonomy, engaged sessions from content, PDP click-through from articles, assisted revenue by path, and SKU-level attribution. Evidence suggests using both leading and lagging indicators to avoid premature judgments.
How long until AI content impacts revenue metrics?
Early signals may appear in 2-4 weeks via impressions and CTR, while assisted and last-click revenue often lag 6-12 weeks. Timelines vary by domain authority, crawl rates, and seasonal demand.
How do I attribute revenue to informational content?
Use assisted-conversion paths, content groupings, and lookback windows in analytics. Pair with product-click events and SKU mapping to observe whether content influenced PDP entrances and checkout.
What dashboard views help merchandising decisions?
A SKU panel with top assisted SKUs, margin, stock status, and related articles may guide featuring alternates when OOS and prioritizing content around profitable or seasonal items.
How do I handle breed and life-stage specificity in reporting?
Segment topics and queries by breed, size, life stage, and condition. Track coverage, rankings, and revenue assists per segment to see where content may require deeper briefs or additional SKUs.
Conclusion
Proving AI content ROI requires a disciplined plan that links query coverage to assisted revenue and SKU-level attribution. Adopt leading and lagging indicators, enforce safety boundaries, and iterate on dashboards weekly. For strategic alignment and content architecture, see AI Content for Pet Brands: Strategy, Priorities, and Playbooks. This evidence-based approach may help teams invest confidently, prioritize high-impact briefs, and translate content output into measurable eCommerce outcomes.
References
- MA Al Khaldy et al. (2023). The impact of predictive analytics and AI on digital marketing strategy and ROI. Conference on sustainability …. View article
- R Sura (2025). Measuring ROI of data and analytics programs: A framework for enterprise impact. World Journal of Advanced Engineering Technology …. View article
- G Deshpande et al. (2020). Beyond accuracy: Roi-driven data analytics of empirical data. Proceedings of the 14th ACM/IEEE International …. View article
- SSR Purmani (2025). Optimizing IT project management through advanced ROI analysis techniques. International Journal for Innovative Engineering …. View article